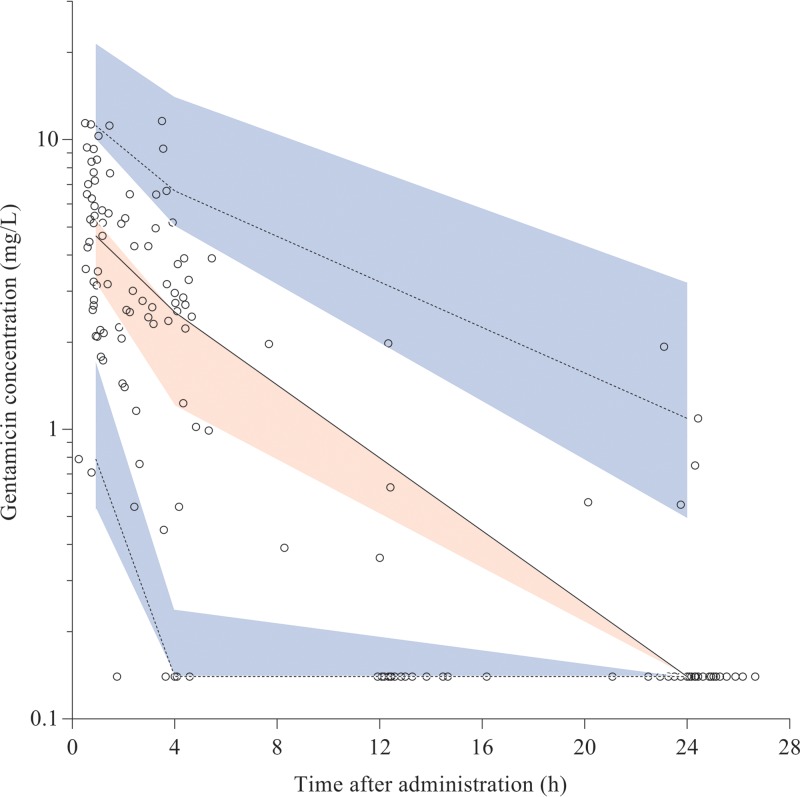
FIG 1.
Observed gentamicin concentration-time data and visual predictive check (VPC) of the final model. Open circles are observed concentrations. Solid line is observed median and dashed lines are 5th and 95th percentiles of the observed data. Red shaded area is the 95% confidence interval (CI) of the model-predicted median; blue shaded areas are the 95% CI of the model-predicted 5th and 95th percentiles. In preparing the plot, the observed and simulated concentrations below the LLQ were set to 0.14 mg/liter (0.5 × LLQ) to promote visual inspection of the figure. Solid and dashed lines run within their respective shaded areas, thereby demonstrating adequate fit of the model.

