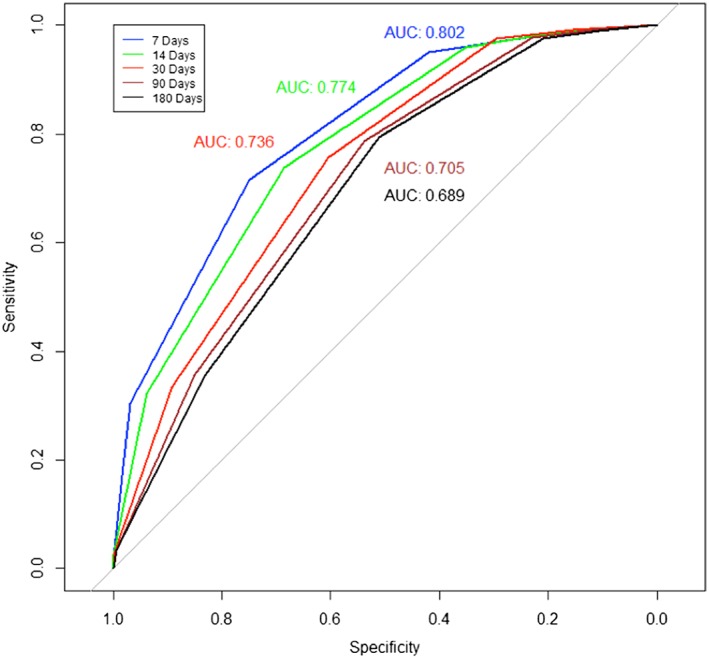
Figure 2.

Receiver operating characteristic (ROC) curve by length of service group. It displays the ROC curve predicting survival based on Palliative Performance Scale Version 2 score values measured on hospice admission across five groups (i.e. 7, 14, 30, 90, and 180 days). AUC, area under the curve.
