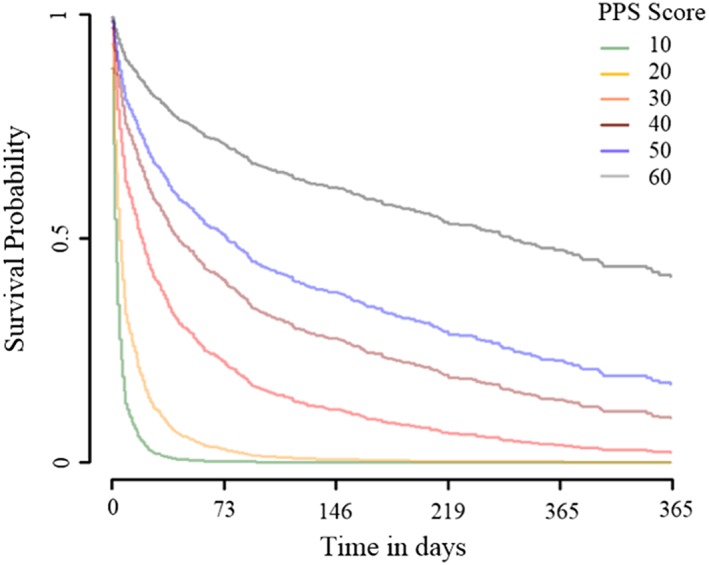
Figure 3.

Adjusted Kaplan–Meier survival curves from multiple Cox regression. It displays adjusted Kaplan–Meier survival curves plotted for each value of the Palliative Performance Scale Version 2 (PPSv2) using Cox regression estimates and average covariate values.
