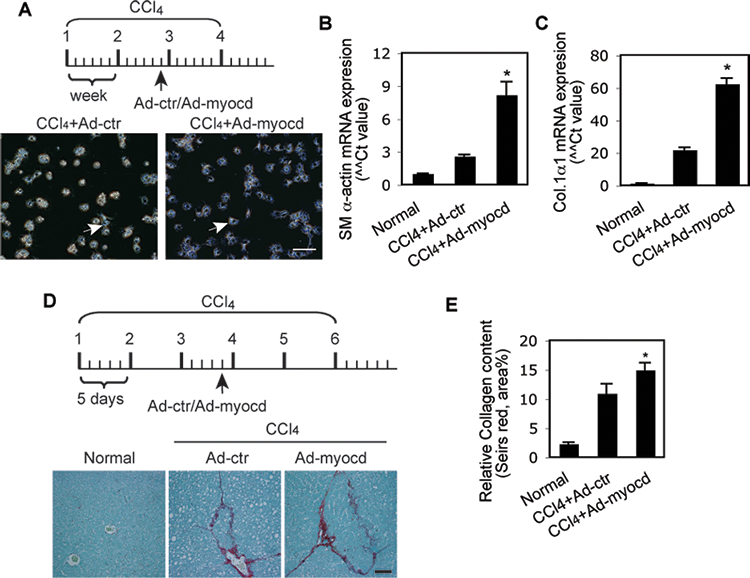
Figure 3.

Overexpression of myocardin promotes HSC myofibroblast differentiation and liver fibrosis. (A) A schematic map for overexpression of myocardin with 4 doses of CCl4. 5 days after the final dose of CCl4, HSCs were isolated and cultured overnight; representative phase contrast images are shown (arrow indicates an activated HSC). (B, C) Total RNA was extracted from the same cells and RT-PCR was performed to detect SM α-actin and Col.1α1 mRNA (n=3, p < 0.01 for Ad-control (Ad-ctr) vs. Ad-myocd). (D) A schematic map for overexpression of myocardin with 6 doses of CCl4. 5 days after the final CCl4 dose, whole liver tissues were harvested and subjected to picrosirius red staining as in Methods. Quantitative data is shown graphically (n=3 ~ 4, p < 0.05 for Ad-control (Ad-ctr) vs. Ad-myocd). The scale bar represents 100 μm.
