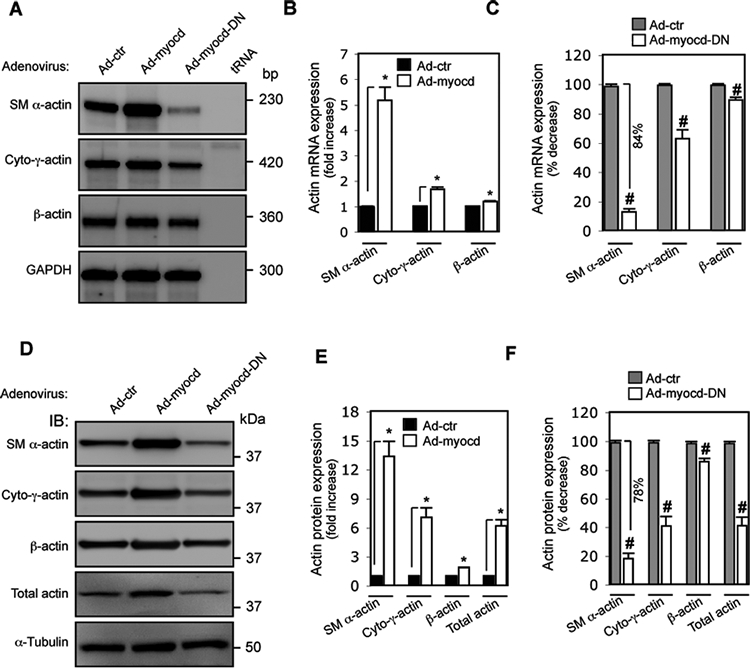
Figure 5.

Myocardin induces differential expression of actin isoforms. HSCs were isolated as above and exposed to adenovirus as indicated for 3 days and then incubated in 0.5% serum medium for 2 days. (A) Actin isoform mRNA profiles were assessed by RNase protection assay (RPA). Representative images from 3 independent experiments are shown. (B) Quantitative data depicting changes in actin isoform mRNA expression induced by myocardin, or dominant negative myocardin (C) are depicted graphically. (D) Whole HSC lysates were subjected to immunoblotting to analyze actin isoform profiles (representative immunoblots from 3 independent experiments are shown) and (E) quantitative data depicting changes in actin isoform expression induced by myocardin, or dominant negative myocardin (F) are presented graphically. (n=4, * p < 0.05 for Ad-control (Ad-ctr) vs. Ad-myocd; # p < 0.05 for Ad-control vs. Ad-myocd-DN).
