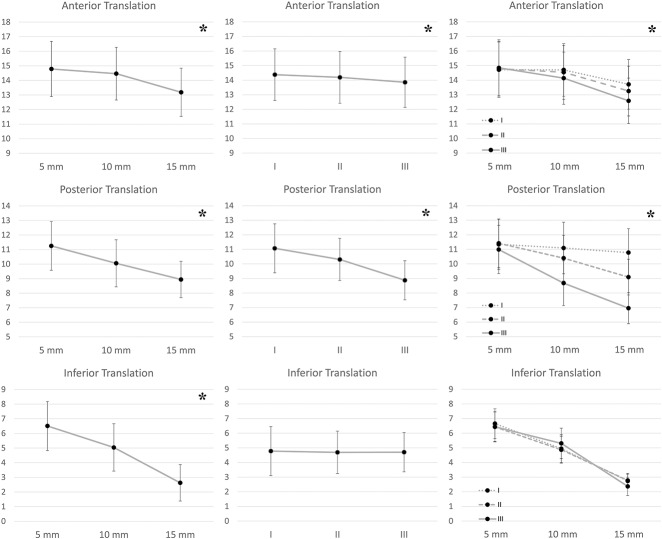
Fig. 5.
Plots of glenohumeral laxity against each modeled effect are shown. Each row of plots is a separate laxity direction (top = anterior, middle = posterior, bottom = inferior) and each column of plots is a generalized estimating equation (GEE) model effect term (left = MAG, middle = SEQ, right = MAG x SEQ). Within each plot the translational values (vertical axis) are plotted against the effect levels. Values are shown as the marginal mean ± 1.0 standard error. The interaction plots (MAG x SEQ, third column) show three lines instead of one, and their divergence indicates an increasing restriction of plication magnitude across plication sequence. *Statistically significant effect (p < 0.05).

