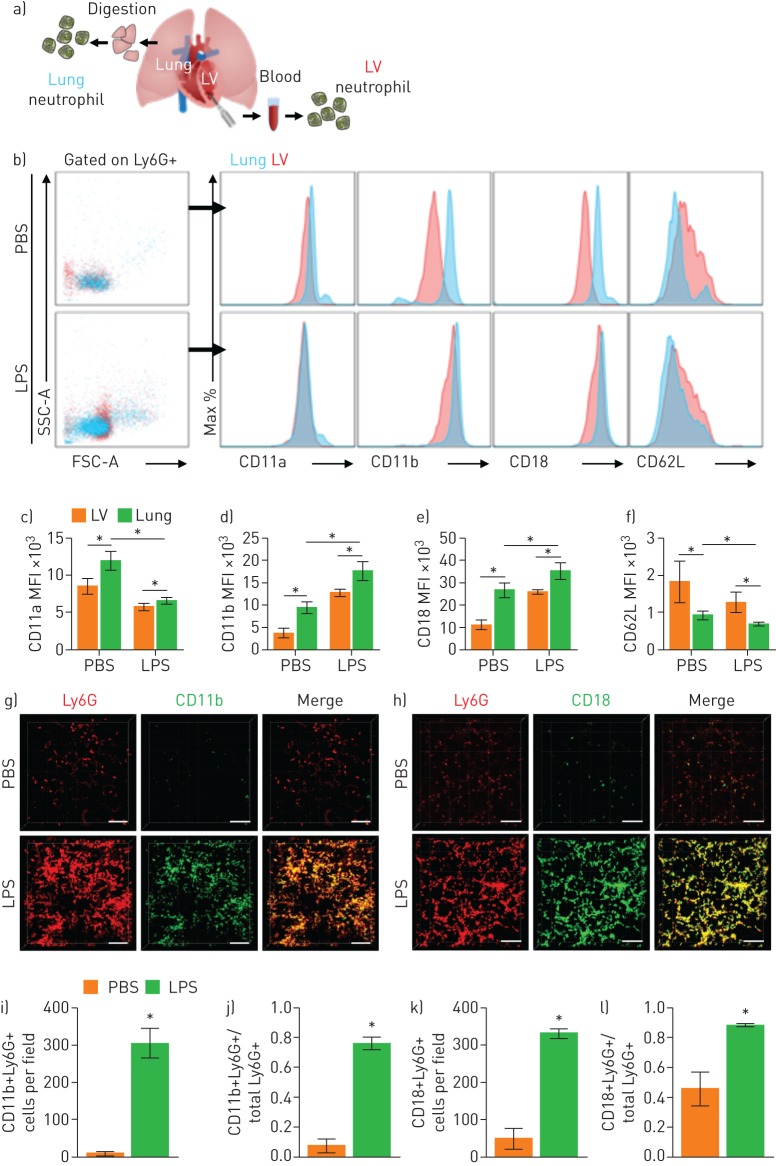
FIGURE 6.
Mac-1 integrin is upregulated in entrapped neutrophils in the pulmonary microcirculation. a) Schematic diagram showing isolation sampling of two groups of neutrophils (lung, blue; left ventricle (LV), red). b) Surface expression of integrin of Ly6G+ cells from the lung and LV. c–f) Comparisons of expression of integrin from flow cytometry in the PBS and lipopolysaccharide (LPS) groups (n=5 per each group, Mann–Whitney test, *p<0.05). Data are presented as mean±sd. g, h) Representative three-dimensional intravital imaging of integrin in sequestered neutrophils. Cellular surface expression of CD11b (green) and CD18 (green) in Ly6G+ cells (red) is visualised in vivo. Scale bars, 100 µm. i–l) Comparisons of number of CD11b+Ly6G+ cells and CD18+Ly6G+ cells and ratios of CD11b+Ly6G+ cells and CD18+Ly6G+ cells over total Ly6G+ cells in the PBS and LPS groups (n=9, three fields of view per mouse, three mice per group, Mann–Whitney test, *p<0.05). Data are presented as mean±sd. SSC-A: side scatter-area; MFI: mean fluorescence intensity.

