
Figure 3.
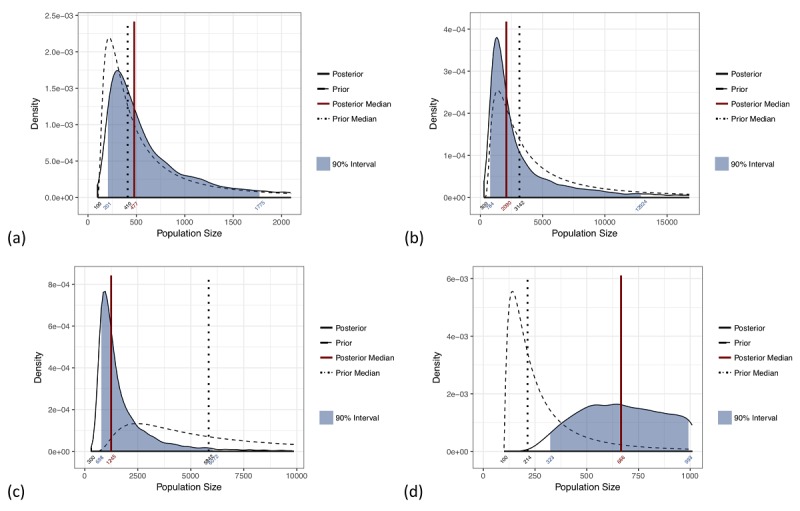
Posterior distributions for the size of selected populations: (a) people who inject drugs (PWID), Vanadzor 2016; (b) female sex workers (FSW), Yerevan 2016; (c) PWID, Yerevan 2016; and (d) men who have sex with men (MSM), Vanadzor 2016. The 90% credible interval is indicated by the shaded blue region and the posterior median by a vertical red line.