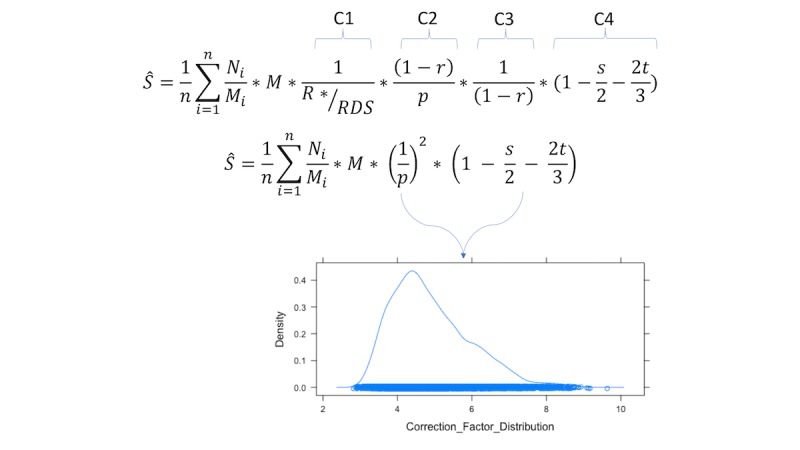
Figure 2.

Respondent-driven sampling adjusted reverse tracking method equation (complete and simplified). Correction factors are calculated from the simulated distributions, from which the 2.5 percentile and 97.5 percentile are used to calculate 95% simulation intervals. Key: Ŝ=the estimated population size; n=the number of venues visited on the second visit; Ni=the number of people observed at venue i on the second visit; Mi=the number of people observed at venue i on the first visit; M=the total number of people observed at all venues on the first visit; R*=the sum of the number of times that a mapped venue is reported from the venue inquiry questions; RDS=the RDS sample size; r=the proportion of the RDS sample that reports not going to any venues; p=the proportion of the RDS sample that report attending a mapped venue; s=the proportion of venue-attending RDS participants who attend two venues; t=the proportion of venue-attending RDS participants who attend three venues.
