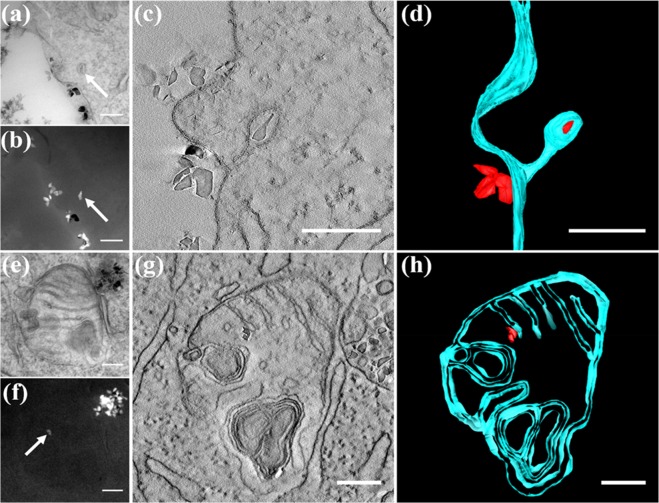
Figure 4.
Interactions of single fNDs with cellular substructures. (a,b) Bright-field TEM and dark-field EFTEM of single fND uptake; (e,f) Bright-field TEM and dark-field EFTEM of fNDs inside a mitochondrion. (c,g) Virtual slices from the tomogram, whereas (d,h) give the segmentation of the tomograms of single fND uptake and localization inside a mitochondrion, respectively. Scale bar: 200 nm.

