
Figure 5.
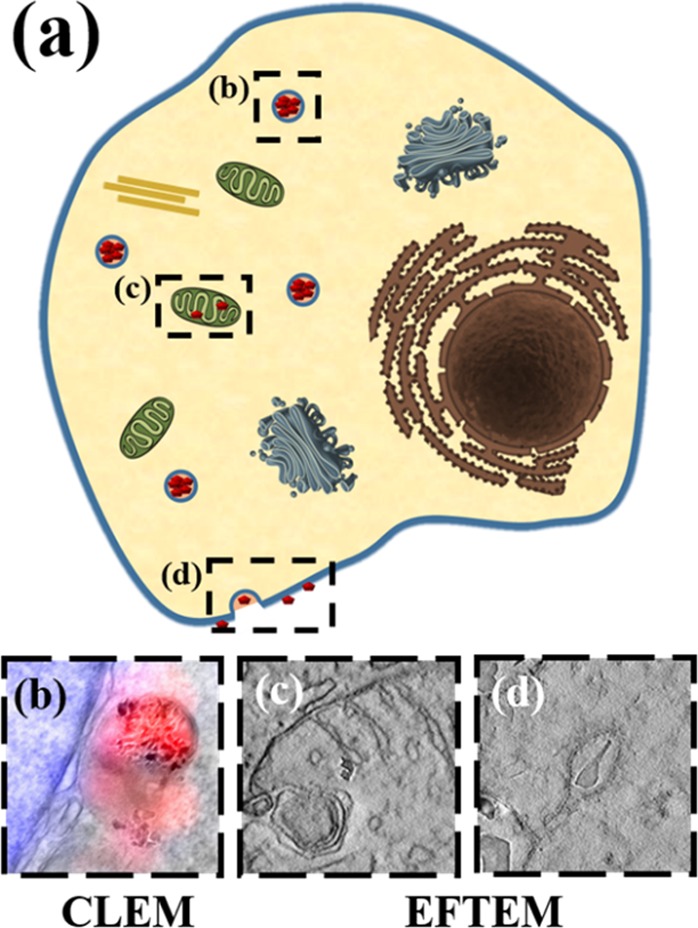
(a) Visualization of fNDs in different cellular environments. (b) Identification and quantification of fNDs in intracellular vesicles using CLEM. In addition, single fND detection was achieved by EFTEM (c) inside a mitochondrion as well as (d) in the cellular membrane during fND uptake.