Figure 4.
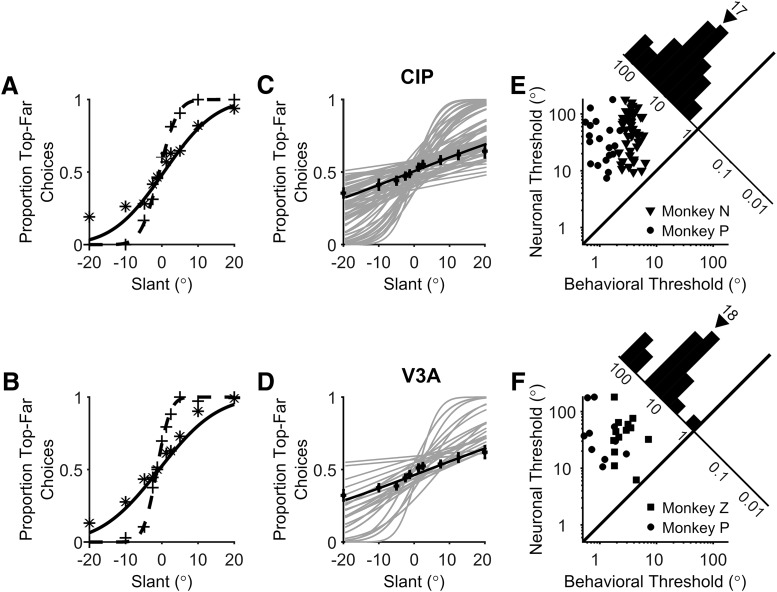
Comparison of behavioral and neuronal sensitivity. A, B, The proportion of top-far choices made during the recordings of the CIP (A) and V3A (B) neurons from Figure 3 are plotted as a function of slant (+ symbols). Simultaneously measured neuronal responses were converted into neurometric functions using ROC analysis and the proportion of top-far choices of an ideal observer are plotted as a function of slant (* symbols). Dashed and solid curves show cumulative Gaussian fits to the psychometric and neurometric functions, respectively. C, D, Gray curves show cumulative Gaussian fits to the neurometric functions of each neuron recorded during the slant discrimination task. Black symbols and curves show average neurometric functions across animals and neurons. Error bars denote SEM. E, F, Behavioral and neuronal thresholds are compared for all individual experiments for monkeys N (triangles), P (circles), and Z (squares) for CIP (E) and V3A (F). Neuronal thresholds are multiplied by . Diagonal histograms show distributions of neuronal to behavioral threshold ratios. Triangles above the histograms mark median threshold ratios.

