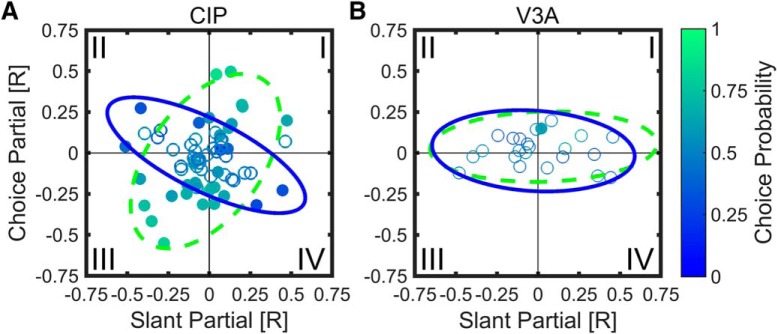
Figure 7.
Partial correlation analysis showing relationships between slant partial correlation, choice partial correlation, and CP. Choice partial correlation is plotted as a function of slant partial correlation with individual neurons color coded to indicate CP. Significant CPs are filled, nonsignificant CPs are open. A, B, Data are shown for 65 CIP (A) and 23 V3A (B) neurons. Curves show 95% confidence ellipses fit to data points with CP > 0.50 (green dashed) or CP < 0.50 (blue solid). A, In CIP, as indicated by the oblique orientations of the 95% confidence ellipses, CPs > 0.50 (greener) tended to occur when the slant and choice partial correlations had the same sign (quadrants I and III), whereas CPs < 0.50 (bluer) tended to occur when the slant and choice partial correlations had opposite signs (quadrants II and IV). B, For V3A, choice-related activity was weak, as indicated by the elongated but horizontally oriented 95% confidence ellipses.

