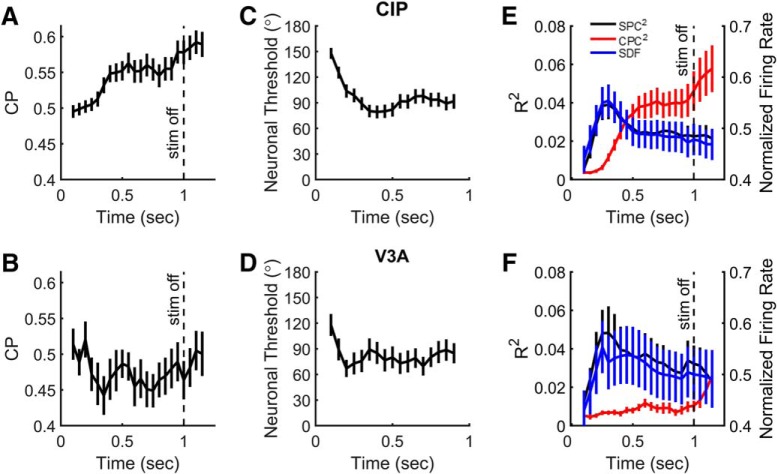
Figure 8.
Time courses of choice probability, neuronal threshold, and partial correlations. A, B, Mean values of CP for CIP (A) and V3A (B) neurons as a function of time relative to stimulus onset. C, D, Mean neuronal thresholds (multiplied by ) for CIP (C) and V3A (D) as a function of time. E, F, Mean SDFs (blue) as well as squared slant (SPC, black) and choice (CPC, red) partial correlations for CIP (E) and V3A (F) as a function of time. In all plots, analysis bins are 200 ms in duration, shifted every 50 ms starting at 100 ms. Each point is plotted in the center of the 200 ms time bin. Error bars denote SEM. Vertical dashed lines in A, B, E, and F mark the end of the stimulus presentation. The last time bin is centered at 1150 ms, and thus extends approximately until the median choice time (1271 ms after stimulus onset).

