
figure 3:
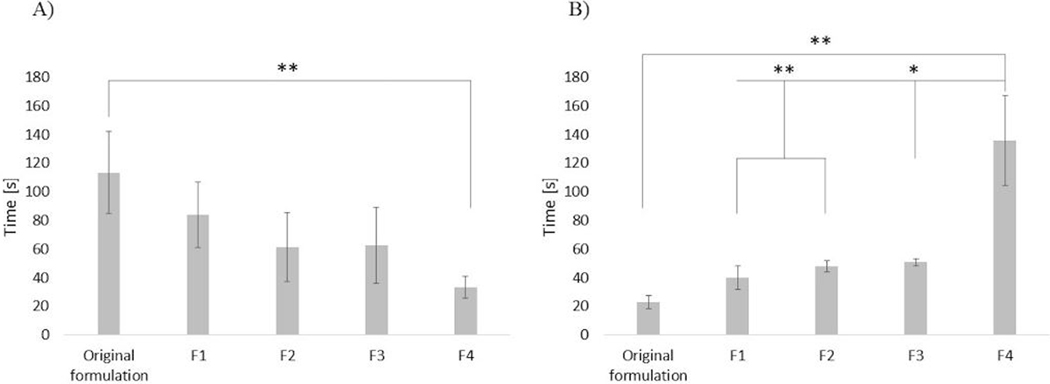
a) transition time for n=3 samples of each hydrogel formulation and b) reverse conditions. statistical significance determined using one-way analysis of variance (anova) with *p < 0.05 and **p < 0.01.
Official websites use .gov
A
.gov website belongs to an official
government organization in the United States.
Secure .gov websites use HTTPS
A lock (
) or https:// means you've safely
connected to the .gov website. Share sensitive
information only on official, secure websites.
a) transition time for n=3 samples of each hydrogel formulation and b) reverse conditions. statistical significance determined using one-way analysis of variance (anova) with *p < 0.05 and **p < 0.01.