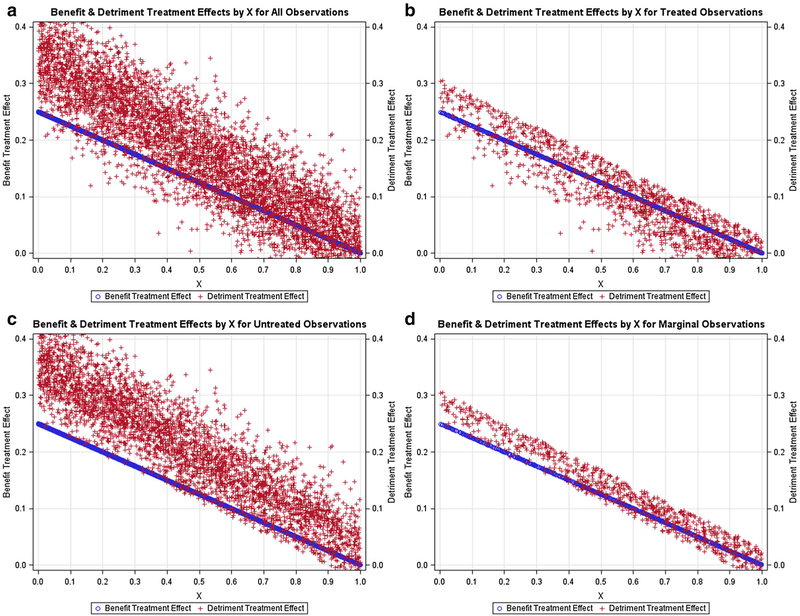
Fig. 3.
Positive relationship between benefit and detriment treatment effects: Scatter plots containing the benefit probabilities and detriment probabilities for subsets of the simulated population in scenario III. a All simulated patients, b simulated patients who chose treatment T, c simulated patients who chose the alternative treatment, d marginal simulated patients, or those whose treatment choice would have changed if their instrument value switched

