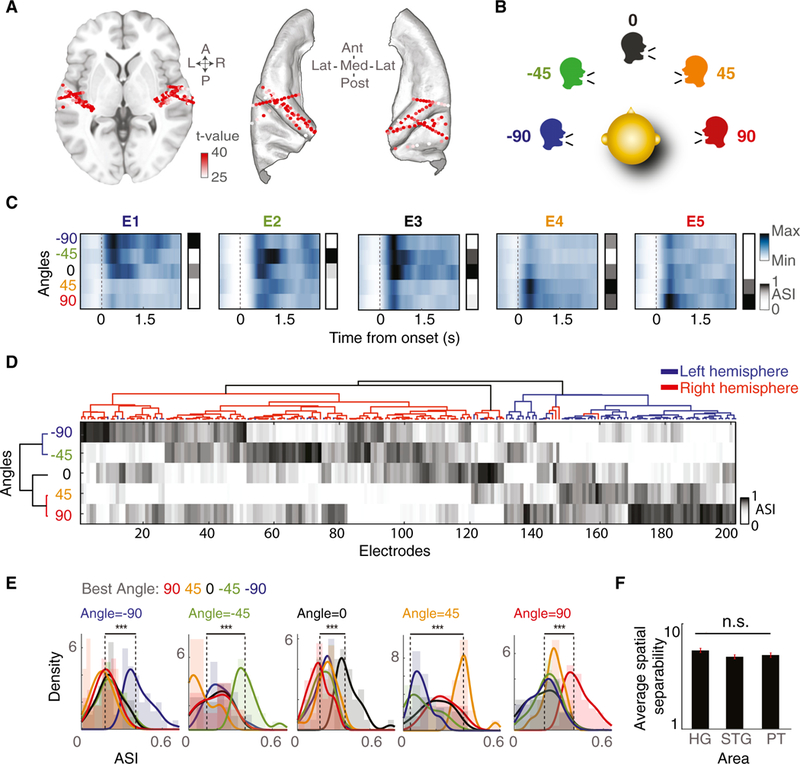
Figure 1. Direction Selectivity of Responses in the Human Auditory Cortex.

(A) Speech-responsive electrodes from all subjects shown on an ICBM152 average brain on axial MRI (left) and on core auditory areas (right). Color saturation indicates the speech versus silence t value for each electrode.
(B) Task schematic. Subjects are presented with speech uttered from five color-coded angles in the horizontal plane.
(C) Average high-gamma responses and ASIs of five representative electrodes to −90°, −45°, 0°, 45°, and 90° angles.
(D) Hierarchical clustering of angle selectivity indices (ASIs) for all electrodes (columns) and angles (rows). Electrode clusters are shown by the dendrogram at the top, whereas angle clusters are shown by the dendrogram on the left; electrode clusters in red and blue indicate electrode locations in right and left brain hemispheres, respectively.
(E) Histograms of ASI for a given sound angle; each electrode group is colored by its BA.
(F) Average separability of direction (f statistic) in the Heschl’s gyrus, STG, and PT. The error bars indicate SE.
***p < 0.001. See also Figure S1.
