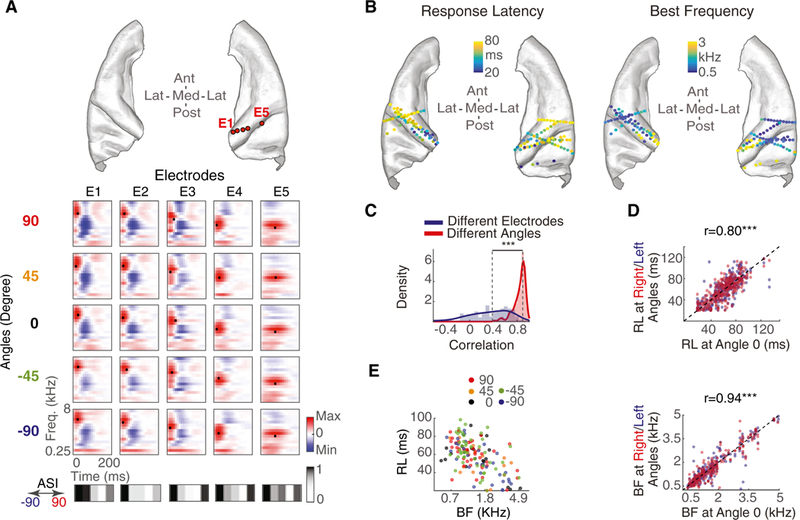
Figure 3. Independent Encoding of Spatial and Spectrotemporal Features.

(A) Top: five example electrodes from one subject. Bottom: spectrotemporal receptive fields (STRFs) of these electrodes. Each column is one electrode, and each row is a different speech direction from which the STRF is calculated. The best frequency (BF) and response latency (RL) for each STRF are marked with a black dot. ASI vectors of each electrode are shown below.
(B) Electrodes plotted on the core auditory cortex of ICBM152, color-coded by BF (right) and RL (left).
(C) Histograms of correlation between STRFs from the same angle but different electrodes (blue) compared with STRFs from the same electrode but different angles (red).
(D) RL and BF for right or left angles versus RL and BF for angle 0°. Electrodes are color-coded by angle (red, right side; blue, left side).
(E) BF versus RL plot for all speech-responsive electrodes, colored by their best angle (BA) tuning.
***p < 0.001. See also Figure S4.
