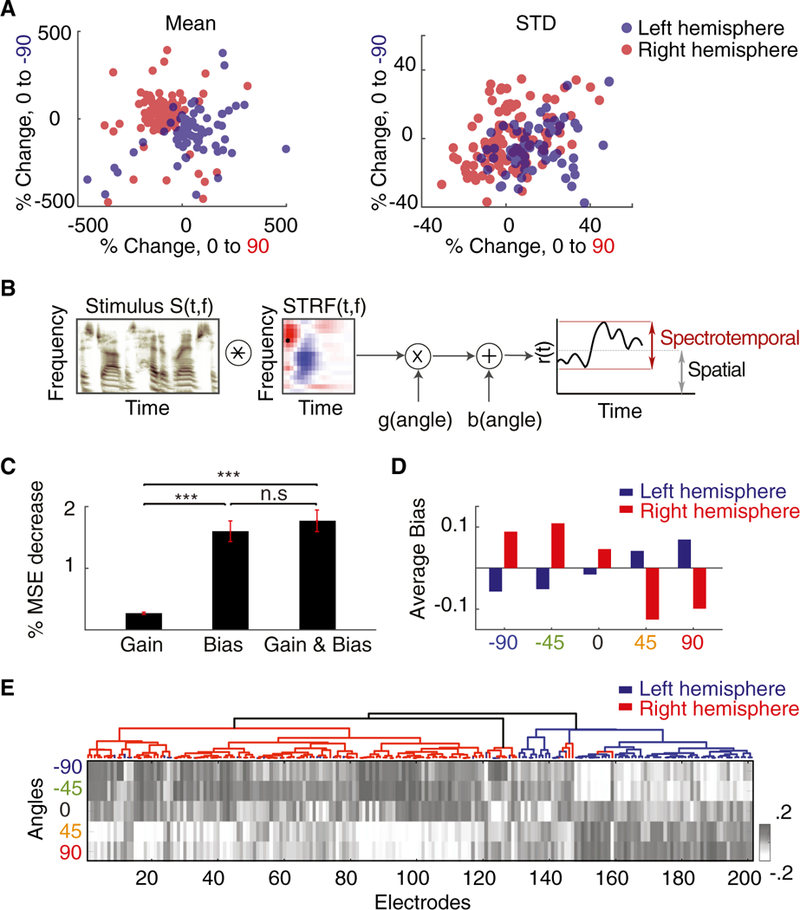
Figure 5. Mechanism of Joint Encoding of Spatial and Spectrotemporal Features at Individual Electrodes.

(A)Scatterplot of percentage change of the mean (left) and standard deviation (right) of neural responses relative to the baseline (angle 0°) for angle 90° (x axis) and angle —90° (y axis) forall electrodes.
(B) Proposed computational model. The auditory spectrogram of speech, S(t,f), is convolved with the electrode’s STRF and then modulated by a gain and a bias factor that depend on the direction of sound.
(C) Mean reduced prediction error of the neural responses relative to baseline (non-spatial STRF) when modulating the gain, the bias, or both in the model. The error bars indicate SE.
(D) Average bias values for five angles from all speech-responsive electrodes colored by right (red) and left (blue) brain hemispheres.
(E) Mean response level (bias) values for five angles from each speech-responsive electrode arranged by ASI and colored by right (red) and left (blue) brain hemispheres.
***p < 0.001. See also Figure S6.
