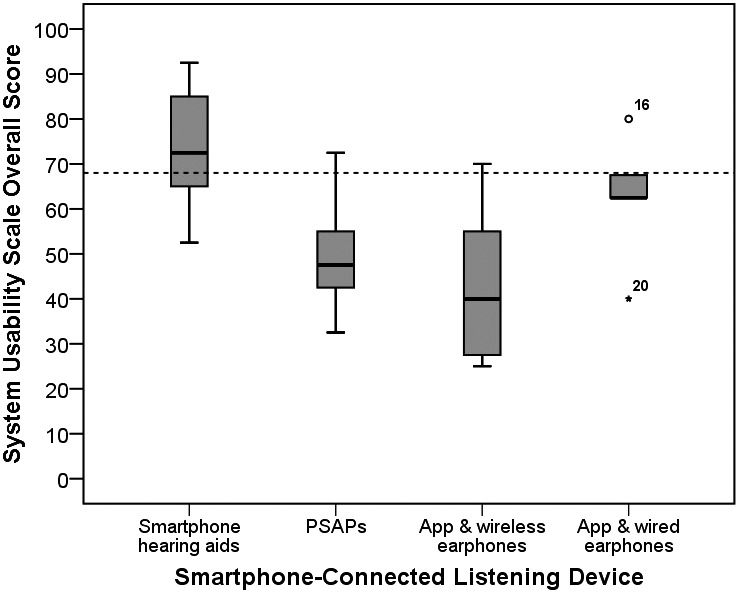
Figure 2.

Boxplots showing overall System Usability Scale (Brooke, 1996) scores for each smartphone-connected listening device group. Dashed line denotes a score of greater than or equal to 68, which is considered above average (Sauro, 2011). PSAPs = personal sound amplification products.
