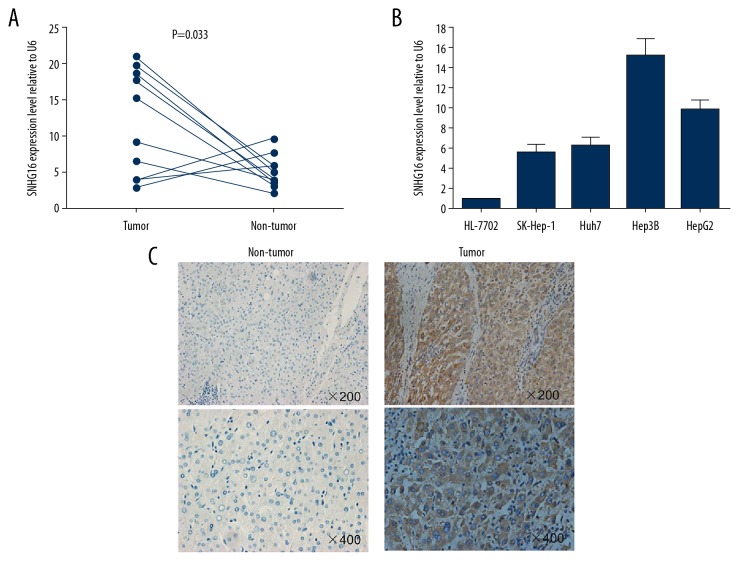
Figure 1.
SNHG16 overexpression in HCC tissues and cell lines. (A) Analysis of SNHG16 level in 10 paired HCC samples and adjacent non-cancerous tissues by qRT-PCR (Cohort 1). (B) Analysis of SNHG16 in HCC cell lines and a normal hepatocyte cell line HL-7702. (C) Analysis of SNHG16 expression in HCC tissues by ISH assays (Cohort 2).

