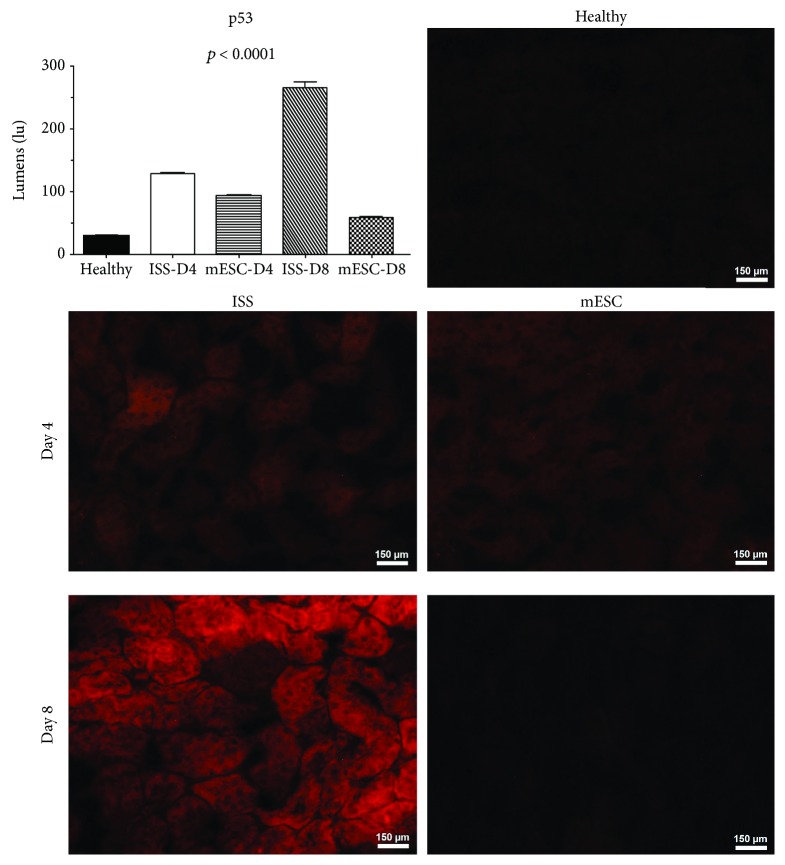
Figure 4.
Immunodetection of p53. The graph displays the quantification of fluorescence of the proapoptotic proteins (p53) on kidney tissue; bars represent the means ± SD. p represents the value of statistical significance in protein expression between the healthy group and isotonic salt solution (ISS) and mouse embryonic stem cells (mESC) groups. Representative images of immunofluorescence of p53 protein on kidney tissues of mice subjected to acute kidney injury (AKI) treated with ISS or mESC at days 4 and 8 post-AKI (n = 5 with three biological replicates, 200x).

