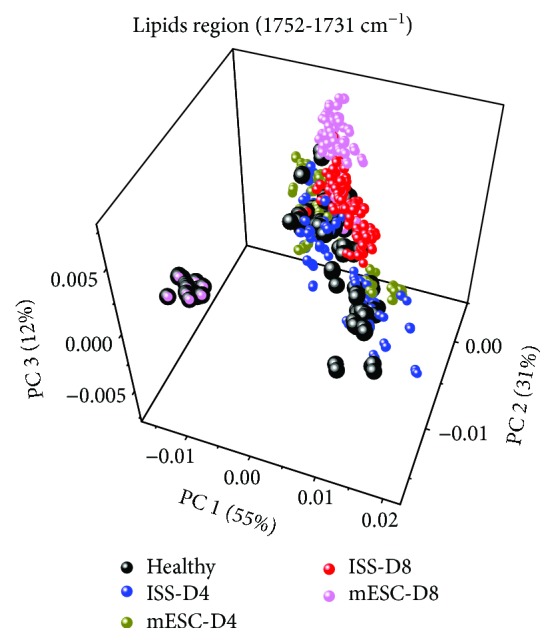
Figure 7.

Principal component analysis (PCA) of lipid region (1752-1731 cm−1). Score plot (PC1 vs. PC2 vs. PC3) from second derivative Fourier-transform infrared microspectroscopy (FTIRM) spectra of healthy mice and mice subjected to acute kidney injury (AKI) treated with isotonic salt solution (ISS) or mouse embryonic stem cells (mESC) at days 4 and 8 post-AKI.
