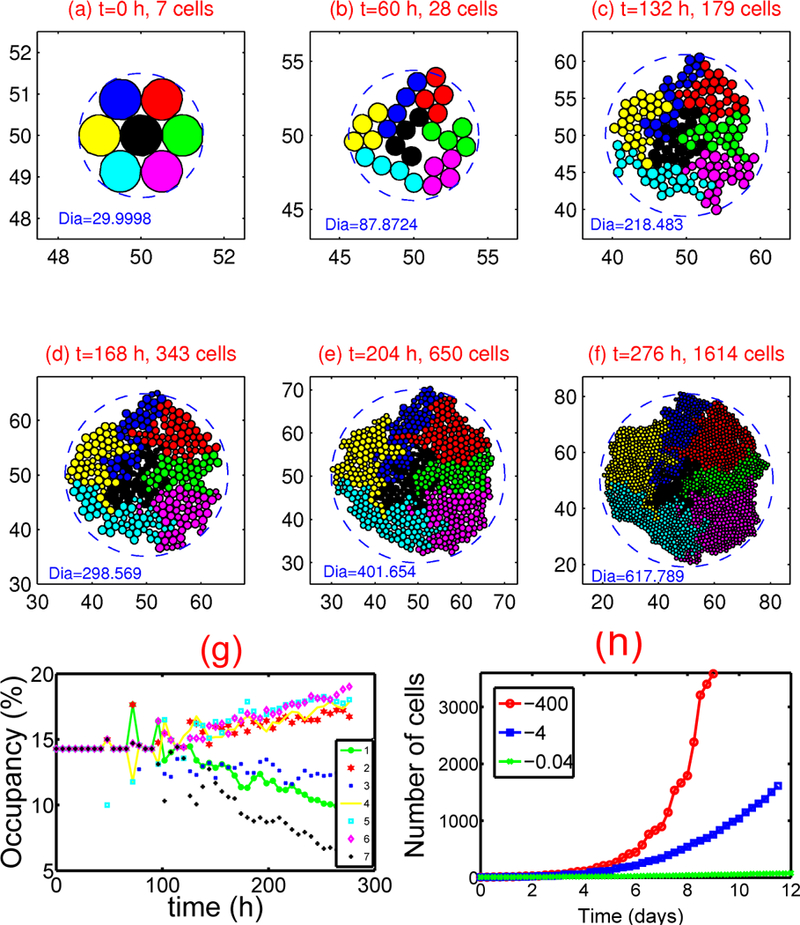
Figure 3:

Tumor growth in the presence of adequate nutrients. (a)-(f) : Tumor growth. Parameters used: σ- =−4.0nN, σ+=800.0nN, c+ = 5.16089 × 10⁻⁹ mm/(min nN) - Dia = diameter in microns. (g) : The occupancy (%) for each clone corresponding to (a)-(f). Notice that the occupancy by cells in the central clone (black cells) decreases significantly compared to other types due to the stress effect on growth. (h) : Growth kinetics for different levels of the compression parameter σ- = −400, −4, −0.04 nN. From [38], with permission.
