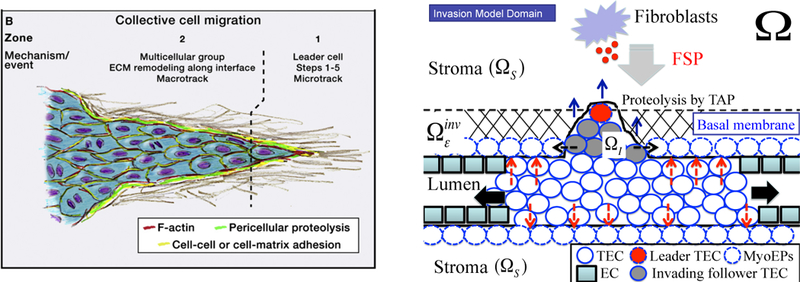
Figure 7:

(Left) A schematic of collective cell migration in a tissue (from [7] with permission). (Right) A schematic of the invasion model used in our work. A TEC is activated (large red circle in ) in response to diffusing FSP (small red circle in ) and generates a microtrack for the invading front by proteolysis of the stromal tissue The follower TECs (gray circles) create the macrotrack through further proteolytic degradation of the ECM. A biochemical/mechanical coordination of those two cell types leads to collective migration (blue arrows) in the invasion region penetration of the initial barrier {basal membrane + myoepithelial cells + ECM and aggressive invasion whileTECs in lumen preferentially proliferate in the longitudinal direction because of low resistant forces (black arrows). Mechanical stresses acting on the intact duct wall are marked as red dashed arrows. Detailed roles of the myoepithelial cells (dashed circle) are not taken into account specifically but rather are embedded in the continuum stromal region
