
Figure 8:
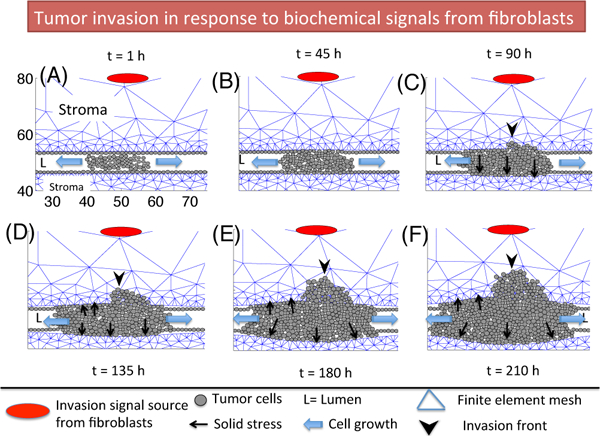
A time course of tumor invasion in response to biochemical signals (red ellipse) from tumor-assisting fibroblasts (TAFs) in stromal breast tissue at t= 1 h (A), 45 h (B), 90 h (C), 135 h (D), 180 h (E), 210 h (F). TECs on the periphery of the breast duct respond to signals from TAFs and begin to open a narrow gap and massive flow of cells follow the leader cell (black arrowhead) in invasion front in panels (C-F), leading to massive transport of TECs into the stroma and increased potential to metastasis.