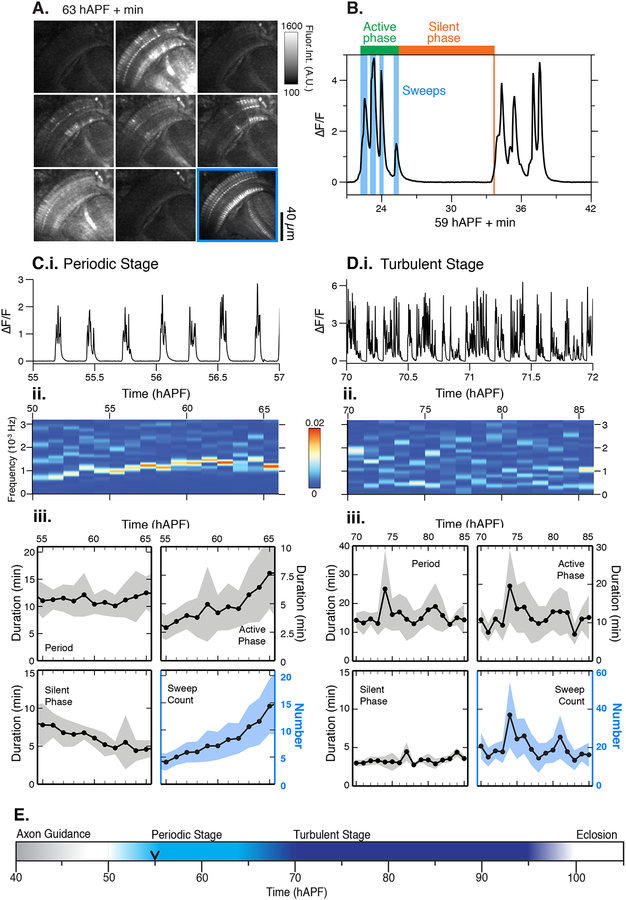
Figure 1. Patterned stimulus independent neural activity (PSINA) in the developing visual system.
A. Micrograph montage showing a single cycle at 63 hAPF; framed panel (lower right) is the average intensity projection through the active phase. B. Representative cycle. C.i. Representative trace during the periodic stage (55–65 hAPF). C.ii. Frequency analysis (Fourier transform) between 50–65 hAPF; C.iii. Average traces of cycle metrics in the periodic stage (n = 54 columns from 6 flies). Shaded area, standard deviation. D.i. Representative trace during the turbulent stage (70 hAPF to eclosion); D.ii. Frequency analysis (Fourier transform) between 70–85 hAPF; D.iii. Average traces of cycle metrics in the turbulent stage (n = 46 columns from 4 flies). Shaded area, standard deviation; E. Summary of spontaneous activity stages during pupal development. Black arrowhead marks the time point after which 100% of columns participate in each cycle. See Table S1 for genotypes.

