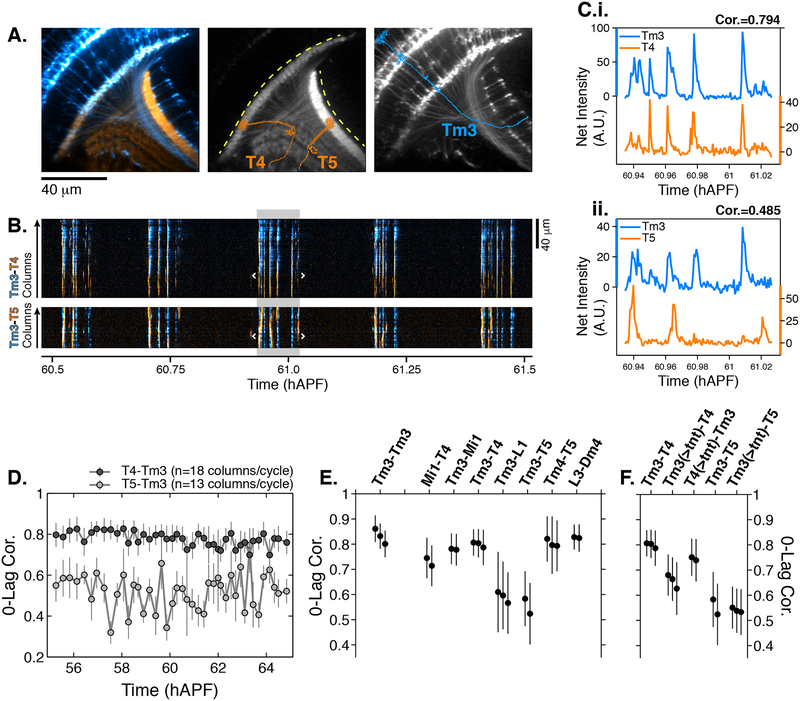
Figure 4. Synaptic release is required for correlated PSINA activity.
A. Average intensity projection images of GCaMP6s expressing Tm3 (blue) and RCaMP1b expressing T4–5 (orange) cells. Single Tm3, T4, and T5 projections are schematically shown. Dashed yellow arcs in center panel abut the thin profiles through M9–10 and the lobula used to generate the kymographs in (B). B. Tm3-T4 (top) and Tm3-T5 (bottom) kymographs of net fluorescence derived from the profiles described in (A). Columns between the white brackets in active phase with gray background were used to generate the plots in (C). C. Tm3-T4 (i) and Tm3-T5 (ii) net fluorescence intensity along the columns marked in (B). D. 0-Lag cross correlation values between 55–65 hAPF for Tm3-T4 (dark gray) and Tm3-T5 (light gray) for the time series used in (A-C). Markers are the average correlation value for 10–20 columns per cycle, gray vertical lines are standard deviation. E. 0-lag correlation values for pairs of cell types, averaged over 55–65 hAPF. Black markers and vertical lines are the average and standard deviation for each time series. Data from 2–3 flies shown per pair. 43+/−10 cycles with 15+/−3 columns per cycle used for each fly. The Tm3-Tm3 pair represents the highest correlation we expect to observe for a perfect match given the signal-to-noise statistics of the data (see Figures S6A–S6B). F. TNT expression in Tm3 reduces Tm3-T4 correlation but has no effect on Tm3-T5 correlation. Data statistics as in (E). Unperturbed pairs reproduced from (E) for ease of comparison. See Table S1 for genotypes used in this figure.

