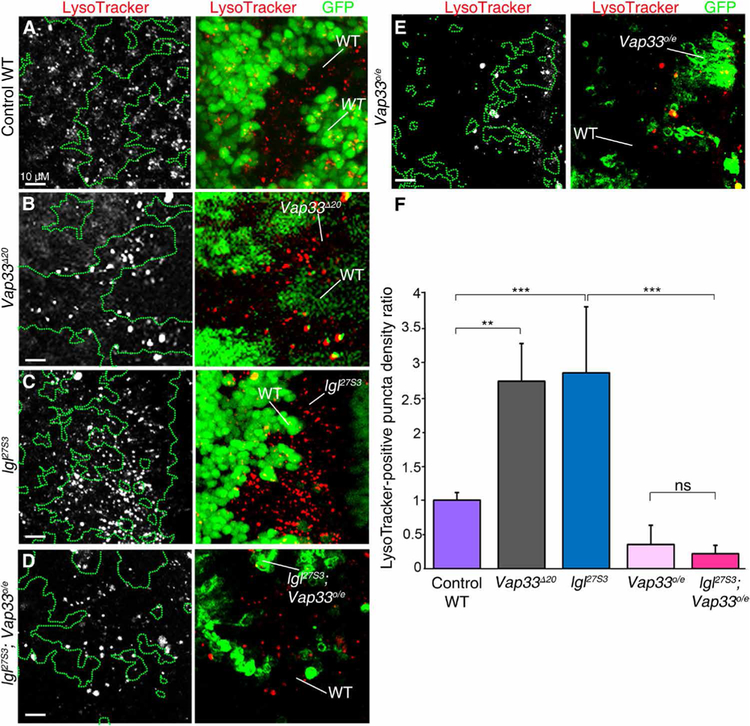
Fig. 5. Vap33 reduces endosomal vesicle acidification in the Drosophila eye epithelium.

(A to E) Confocal images of mosaic third-instar larval eye discs stained with LysoTracker (gray in single-channel images and red in merged images) and showing GFP, which is absent in the mutant clones in B, C, and present in the mutant clones in D, E (MARCM system). (A) Control WT clones. (B) Vap33∆20 clones. (C) lgl27S3 clones. (D) lgl27S3 Vap33o/e clones. (E) Vap33o/e clones. Mutant and WT tissue is indicated in each panel. (F) Quantification of the number of LysoTracker+ puncta in the mutant clones relative to the same area of surrounding WT tissue. The graph shows the average mutant/WT ratio of the number of LysoTracker puncta per unit area for each genotype. n = 2 independent experiments, n = 3 samples analyzed per genotype per experiment. Error bars indicate SEM. ***P < 0.0001, **P = 0.002. ns, differences not significant (t tests with two-tailed distribution and unequal or equal variance). Scale bars, 10 µm.
