Figure 8.
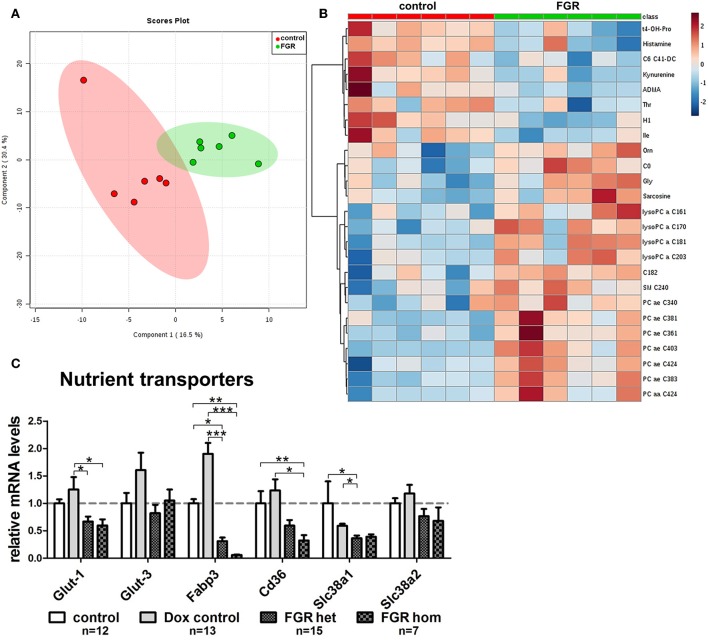
Maternal metabolome analysis and placental expression of nutrient transporter genes in the hsFLT1/rtTA mouse model. (A) Supervised partial least squares discriminant analysis (PLS-DA) of 152 metabolites detected the main metabolomic differences in serum from fetal growth restriction dams (FGR; n = 6; green dots) and control dams (n = 6; red dots). (B) Heat map representation of the top 25 modified metabolites in each group (n = 6 each) mainly indicated accumulation of lysophosphatidylcholines and phosphatidylcholines in serum from hsFLT1–expressing dams (color-coding intensity in the red spectrum shows an increase in the number of given metabolites, and color intensity in the blue spectrum shows a decrease in the number of the given metabolites). (C) Results of quantitative reverse transcription polymerase chain reaction (qRT-PCR) analysis of nutrient transporters in placentas from each group: FGR homozygous (hom; n = 7), FGR heterozygous (het; n = 15), control (n = 12), and doxycycline (Dox) control (n = 13). The mRNA expression levels of glucose transporters Glut-1 and Glut-3, fatty acid transporters fatty acid binding protein 3 (Fabp3) and Cd36, and amino acid transporters solute carrier family members one and two (Slc38a1 and Slc38a2) are lower in hsFLT1–expressing placentas (FGR hom and FGR het) than in control placentas (control and Dox control); the strongest decrease was observed in the fatty acid transporters. Samples were obtained from complete placentas at day 18.5 post coitum (dpc). Measured mRNA levels were normalized to glyceraldehyde-3-phosphate dehydrogenase (Gapdh), and the control group was set at 100% (dotted line). Data is presented as mean ± standard error of the mean. *p < 0.05, **p < 0.01, ***p < 0.001 as determined by the Kruskal–Wallis test with Dunn's post-hoc test.

