Figure 3.

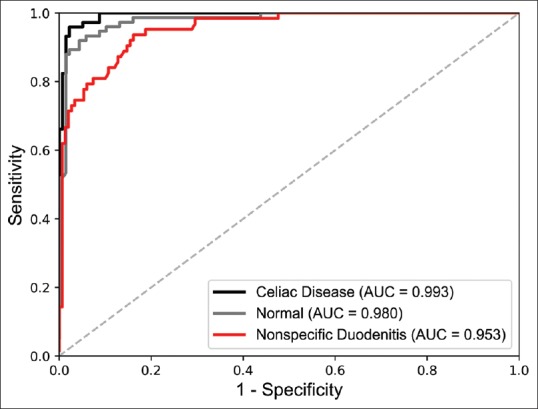
Receiver operating characteristic curves and their area under the curve for our model's classifications on the independent test set of 212 whole-slide biopsy images

Receiver operating characteristic curves and their area under the curve for our model's classifications on the independent test set of 212 whole-slide biopsy images