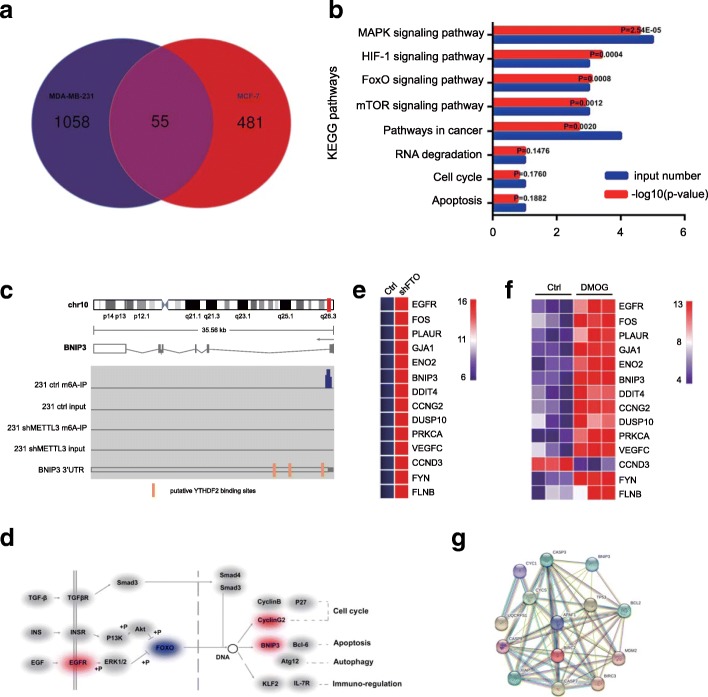
Fig. 4.
RNA-Seq and m6A-Seq identified BNIP3 as a downstream target of FTO-mediated m6A modification. a Venn diagram illustrated overlap in differentially expressed genes in FTO-knockdown MDA-MB-231 cells and MCF-4 cells treated with DMOG. b KEGG analysis shows that FTO-knockdown regulate pathways involved in cell proliferation, cell cycle and apoptosis. c m6A-Seq identification of m6A modification in BNIP3 mRNA near to the YTHDF2 binding sites. d Differentially expressed genes by inhibiting or knockdown of FTO involved in the FoxO signaling pathway. Red color indicates up-regulated genes, while purple color indicates down-regulated genes. e, f Heatmap of up-regulated genes in FTO-knockdown MDA-MB-231 cells (e) and MCF-4 cells treated with DMOG (f). g Co-expression analysis of BNIP3 by the string

