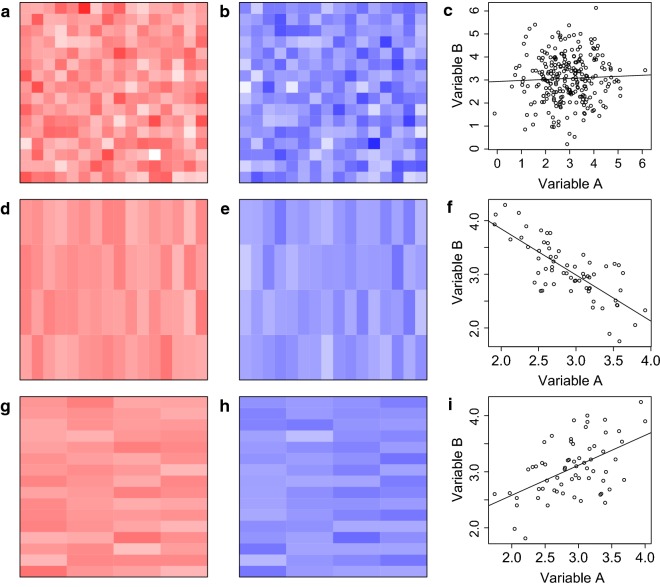
Fig. 2.
Illustrating the MAUP using simulated data. a, b Data for variables (red) and (blue) at a minimal unit of analysis. d, e Shown at one higher-scale zonation. g, h Shown at a second higher-scale zonation. c, f, i The linear relationship between and at the minimal level and at the first and second higher-scale zonations, respectively, with fitted regression lines

