Fig. 3.
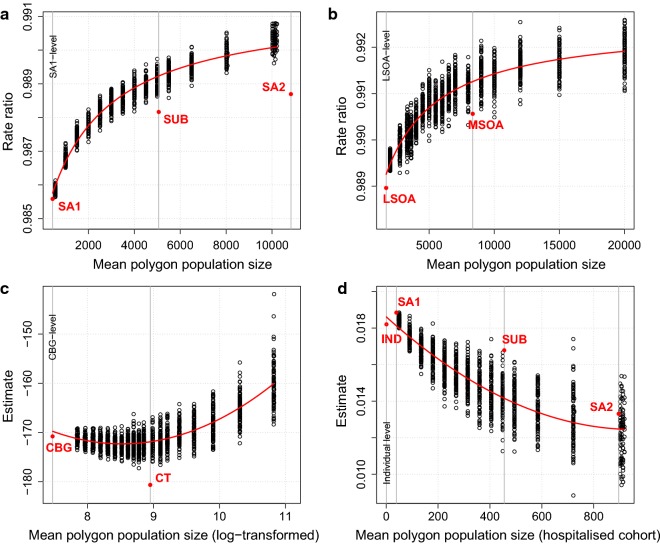
MAUP in different geographies. a Estimated RRs of MH ED presentations associated with a unit increase in IRSAD percentile, at combinations of scale and zonation in Perth. b Estimated RRs of crime associated with a unit increase in socioeconomic percentile in London. c Estimated mean increase in mean Charlson comorbidity index associated with a 1 year increase in mean age in Perth. d Estimated mean decrease in income associated with a 1% increase in percentage black population in Georgia. Fitted lines; estimates from arbitrary administrative zonations [suburb (SUB) and SA2 in a; MSOA in b; Census Tracts (CTs) in c; SUB and SA2 in d]; and minimal level estimates [SA1 in a; LSOA in b; CBG in c; and individual in d] are shown

