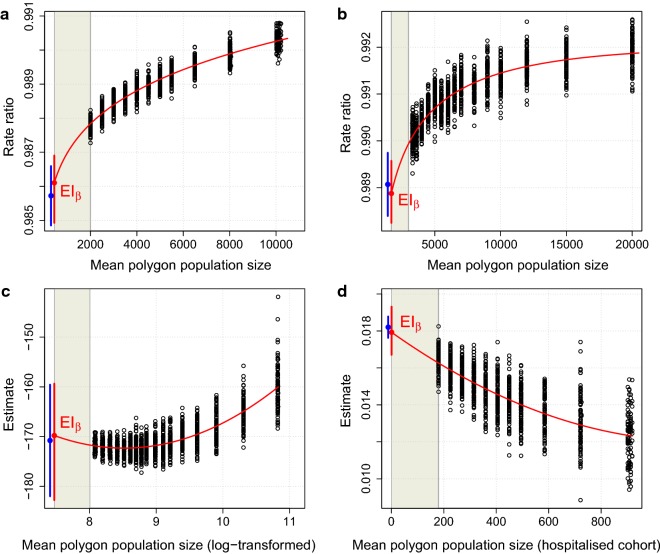
Fig. 4.
Simulation intervals for real-world data. a–d Data in Fig. 3 re-presented under stopping point population sizes of 2000 (a); 3000 (b); 3000 (c); and 2000 (d), respectively. Fitted lines; extrapolated intercepts ( values); and 95% SIs are shown (red), along with minimal-level estimates (SA1 in a; LSOA in b; CBG in c; and individual in d) and their 95% CIs (blue). Shaded regions indicate scales where estimates were intentionally omitted

