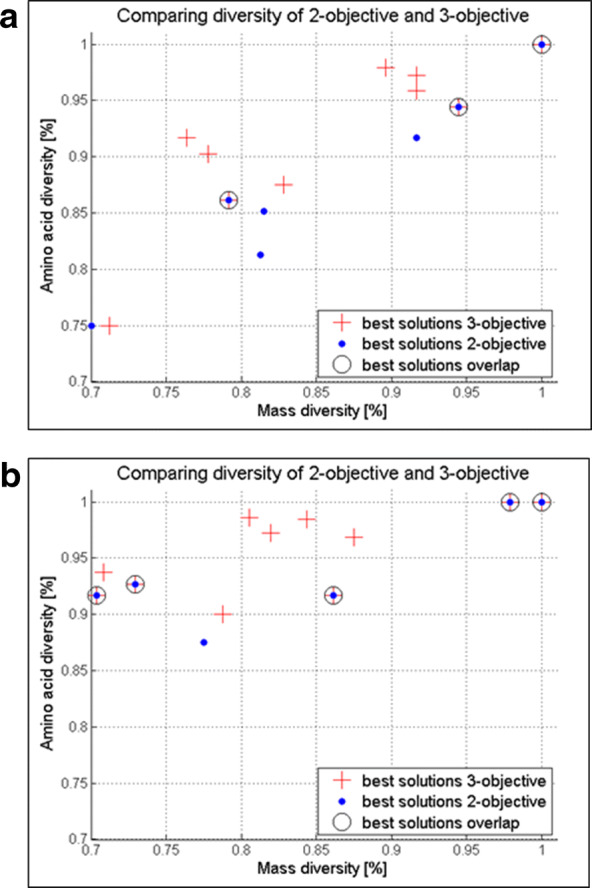
Fig. 6.

3-objective versus 2-objective comparison. Parallel representation of the best solutions obtained by 2-objective (blue dots) and 3-objective (red crosses) optimization marking the overlapping solutions (circled) for the same input data in terms of mass diversity (x-axis) and sequence diversity (y-axis) relative to the total number of permutations for a r = 5, m = 6 and ; library design and for b r = 5, m = 7 and ; , library design
