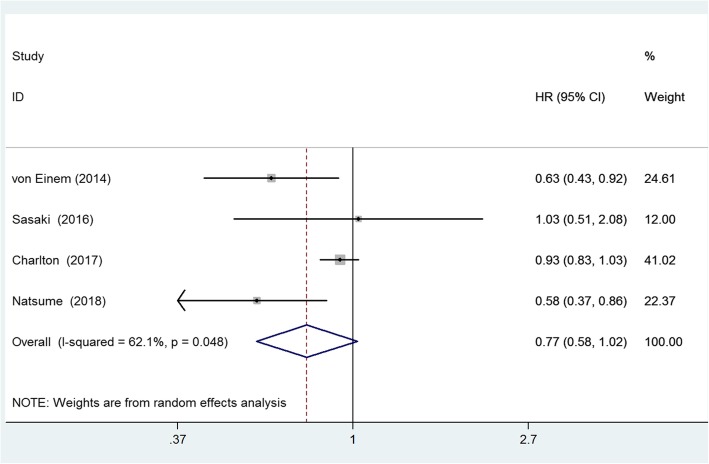
Fig. 4.
Forest plot of the KRAS mutation in the prediction of right-sided colon cancer patients. The squares and horizontal lines correspond to the study-specific HR and 95% CI. The diamond represents the summary HR and 95% CI. The diamond locates to the left but touches the vertical line means the no significant difference between patients with and without KRAS mutation regarding the OS

