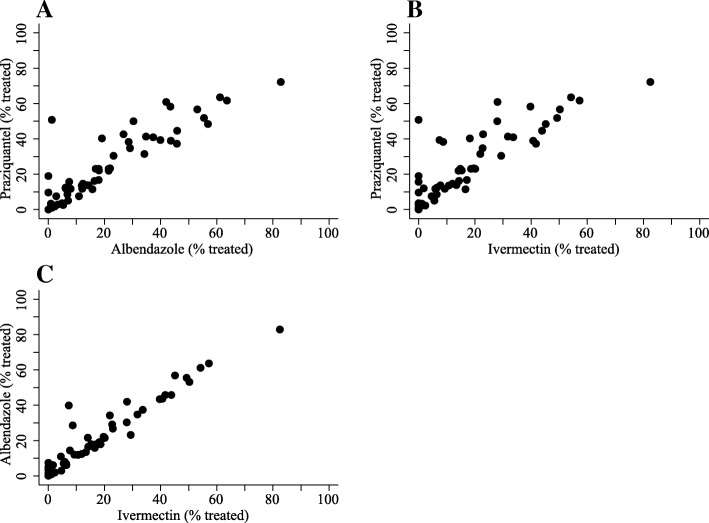
Fig. 3.
Correlation between drug-specific treatment rates. Treatment rates achieved by CMDs (59 obs.) are shown. Treatment rates were measured as the percentage of eligible individuals who were offered and had ingested the drug of interest. The drug-specific treatment rates, i.e. the different outcomes for a CMD, were strongly, positively correlated. a Pearson’s r = 0.898, p value < 0.0001. b Pearson’s r = 0.858, p value< 0.0001. c Pearson’s r = 0.959, p value < 0.0001

