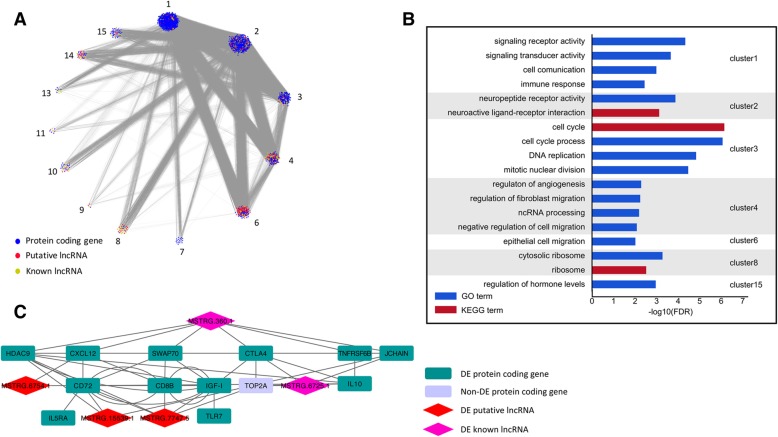
Fig. 4.
Co-expression network of DE protein coding genes and lncRNAs to predict the functional roles of candidate lncRNAs. a co-expression network visualization: nodes represent genes with the top 5% mutual correlation and each edge represents their close connection. b GO and KEGG pathway enrichment analysis for seven clusters with high phenotypic correlation. c sub-network of hub genes and candidate lncRNAs in cluster 1. This describes the relationship between candidate lncRNAs and hub protein coding genes

