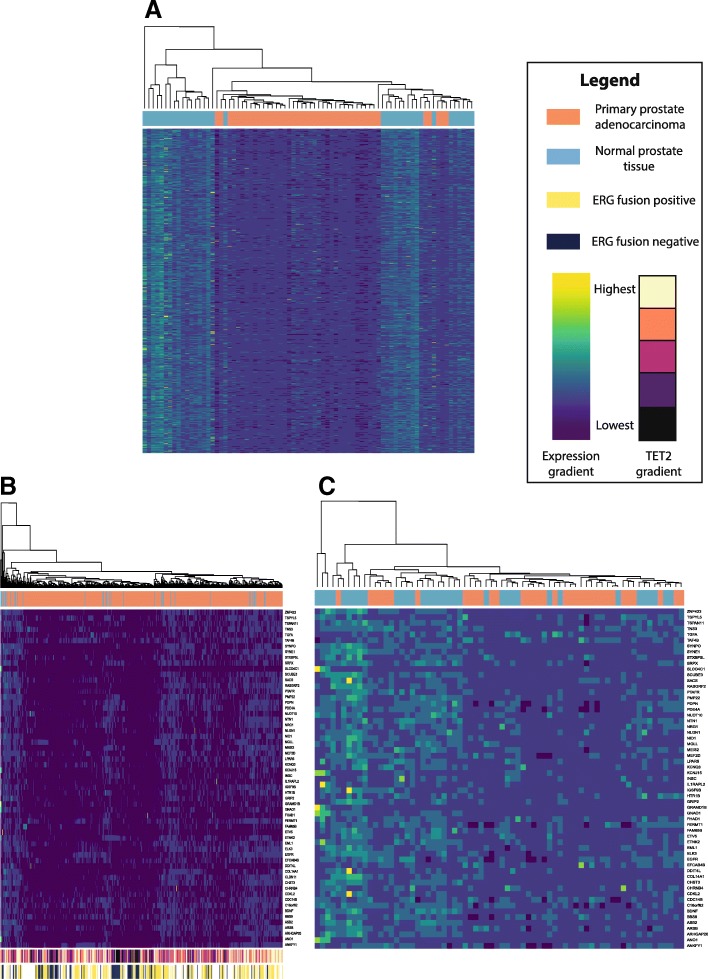
Fig. 2.
Genes exhibiting expression loss in TET2-knockout cell lines show discriminatory ability between normal prostate and prostate tumor based on expression status. Unsupervised heatmaps depict expression values normalized by gene for a 780 genes exhibiting significant loss of expression in both TET2-knockout cells (edgeR, p < 0.05) and a subset of tumors from the Cancer Genome Atlas (TCGA) within the lowest 10th percentile of TET2 expression (Mann-Whitney U, p < 1.193E−5), on this low-TET2 tumor subset; b 60 genes matching the above criteria and exhibiting increased promoter methylation in TET2 knockouts (DiffBind, p < 0.05), in all TCGA tumors with expression data available (n = 423) or c in matched tumor and normal pairs (n = 35). Expression gradient bar indicates normalized expression levels, ranging from highest (yellow) to lowest (dark blue). TET2 gradient bar indicates TET2 expression in the entire TCGA dataset, ranging from highest (cream) to lowest (black). ERG fusion status is annotated in the entire TCGA dataset where data is available. Dendrograms indicate clustering between tissue samples

