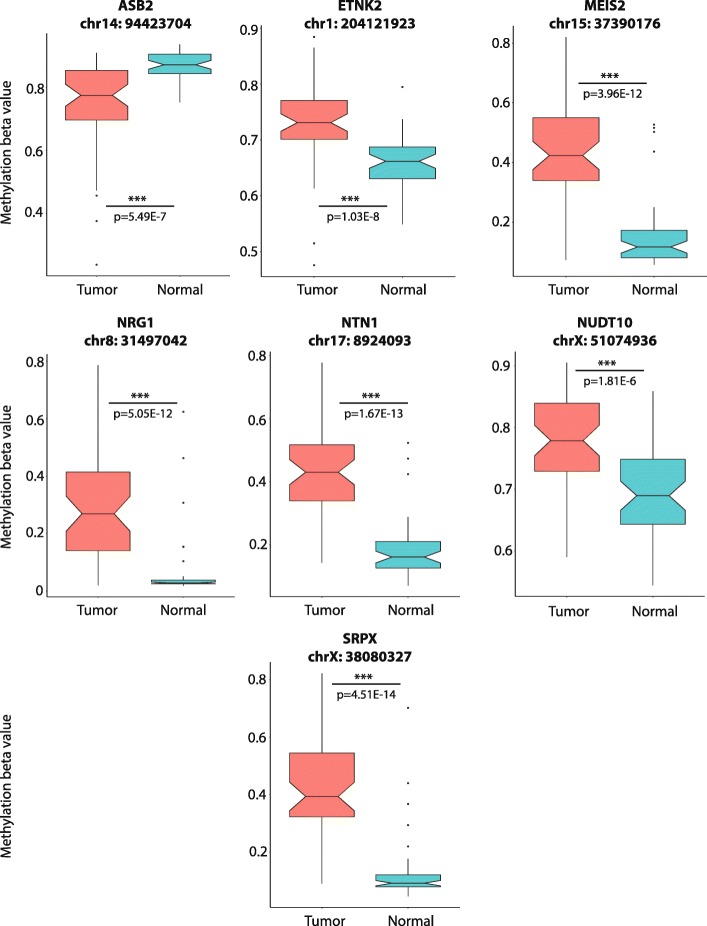
Fig. 6.
Methylation differences between tumor and normal samples for seven candidate genes. Notched boxplots show distribution of methylation beta values from 450 k methylation array for representative methylation probes within 500 bp surrounding the differentially methylated regions observed in candidate genes from our TET2 knockouts in matched tumor vs normal samples (n = 50). Notches indicate 95% confidence interval for medians. Significance for aggregated values determined by Mann-Whitney U test

