
Figure 3.
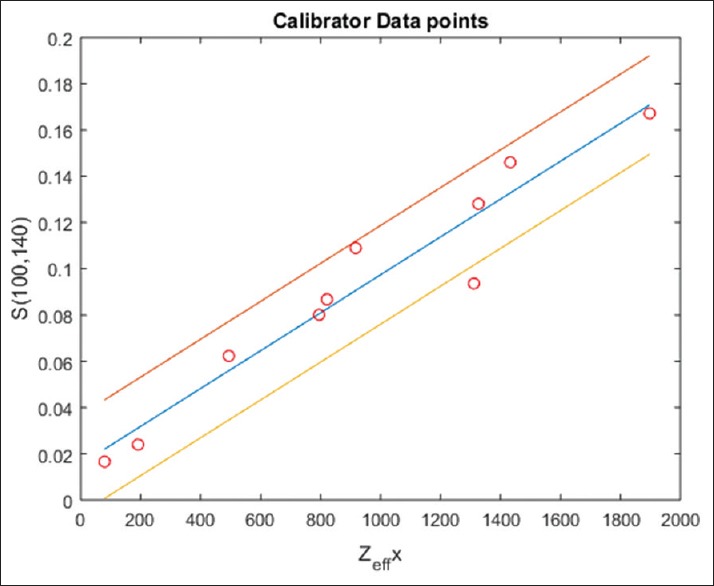
Least square graph fit between Zxeff and S which was used to determine the correlation coefficients c1 and c2 of equation 15. 95% confidence interval was shown by lines drawn above and below the central line. Value of c1 = 0.015 and c2 = 8.187 × 10⁻⁵ (linear regression coefficient r = 0.9636 with P < 0.0001 that is statistically highly significant result) were found by calibrators