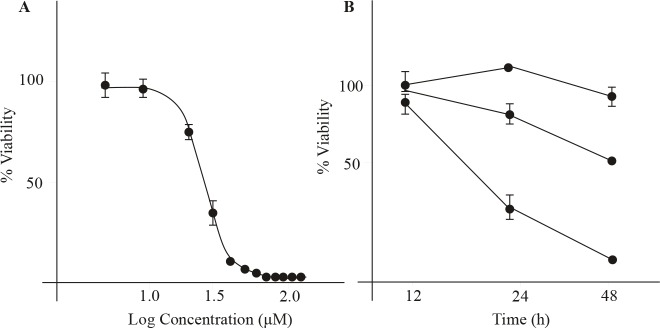
Figure 2.
Dose and time response of NTP’s inhibitory effect on U266 cell viability. A) Dose response and potency (IC50) determination (n = 3). Concentration range was 1.0 to 120 μM. B) Time response (12, 24, and 48 h) of nortriptyline treatment at 5, 15, and 30 μM. Asterisks denote statistical significance at P < 0.001 (n = 3).

