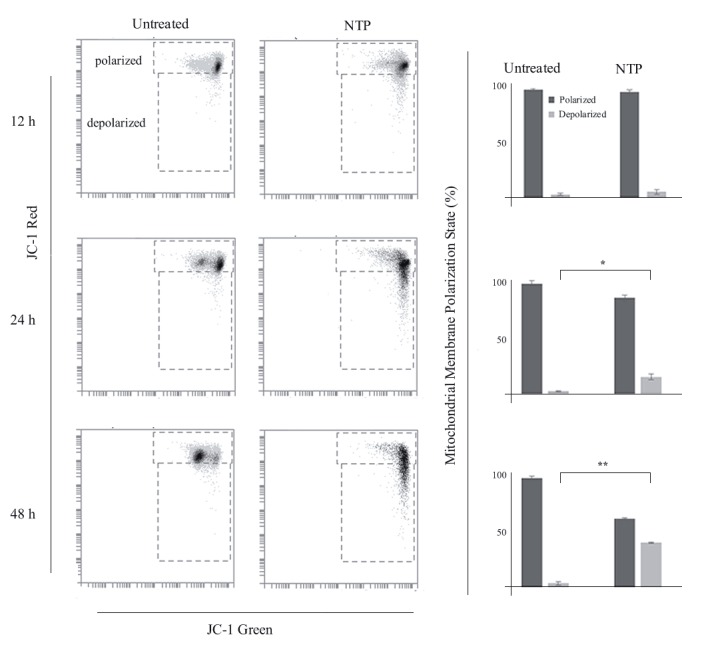
Figure 4.

Effect of nortriptyline (30 μM) on mitochondrial membrane potential as a function of treatment time (12, 24, and 48 h). A) Representative flow cytometry fluorescence intensity dot plots of cells stained with JC-1. Gated fluorescence intensity values for polarized and depolarized states are labeled. B) Bar plots of normalized mitochondrial membrane polarization state values for untreated and nortriptyline-treated cells (n = 3). Error bars (1%–3%) indicate standard error of mean. Asterisks * and ** denote statistical significance at P < 0.05 and P < 0.01, respectively
