
Figure 1.
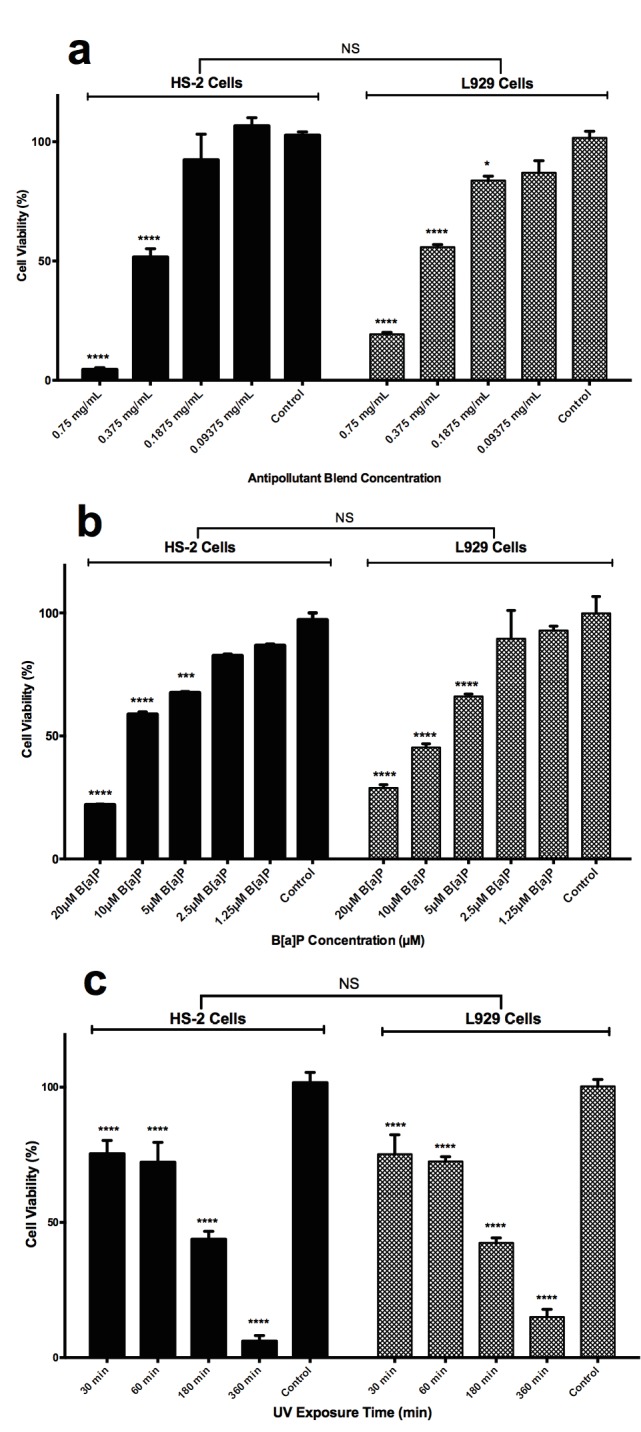
Determination of effective concentration (EC50) values after antipollutant blend treatment (a), inhibition concentration (IC50) value for B[a]P (b), and lethal dose (LD50) value for UVA (c) exposure for HS2 and L929 cells as determined by MTT cell viability assay. Statistical significances are presented as treatment groups compared to nontreated cell controls without any treatments. a) HS2 and L929 cell viability measured by MTT assay after treatment with different concentrations of antipollutant blend for 24 h. b) HS2 and L929 cell viability measured by MTT assay treated with different concentrations of B[a]P for 24 h. c) HS2 and L929 cell viability measured by MTT assay after different doses of UVA. Data are presented as mean ± SD. Statistical significance: nonsignificant (NS), P > 0.05; * P < 0.05; ** P < 0.01; *** P < 0.001; **** P < 0.0001.