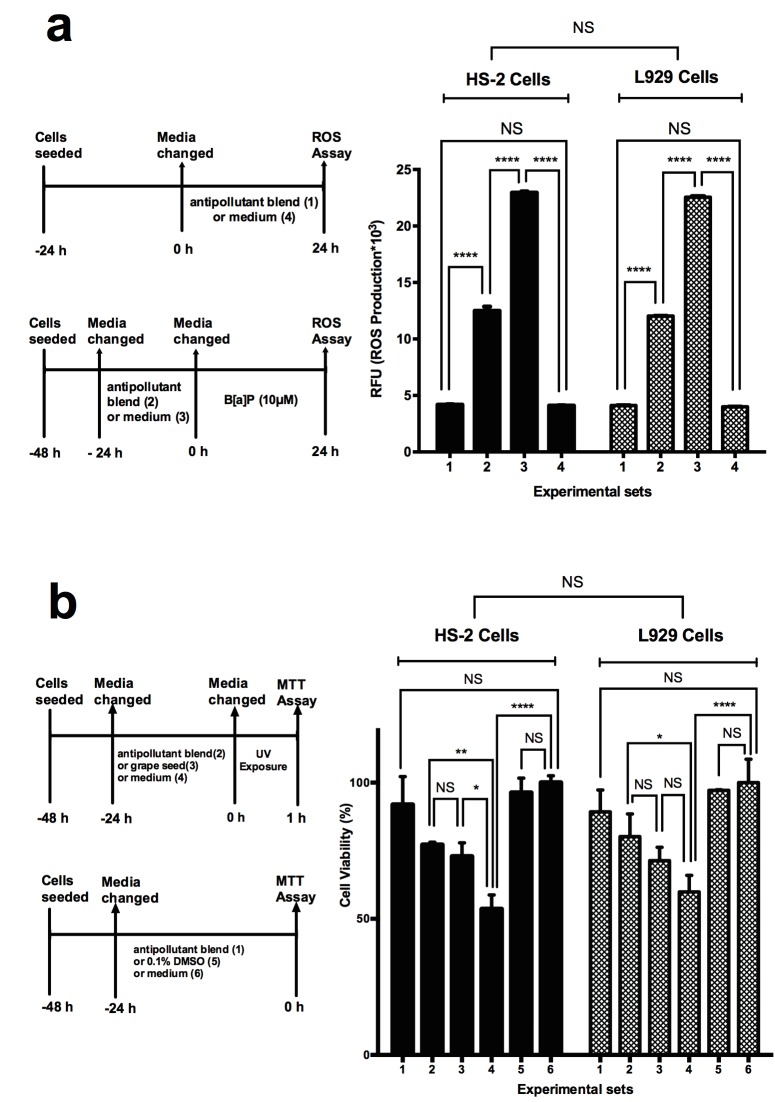
Figure 2.
Determination of antipollution effect of the natural plant extract on HS2 cells and L929 cells after B[a]P and UVA exposure by ROS assay and MTT assay. a) ROS assay results: 1st group, antipollutant blend treatment only for 24 h; 2nd group, 24 h of B[a]P exposure to cells treated with antipollutant blend prior to B[a]P for 24 h; 3rd group, cells incubated with B[a]P for 24 h as control of group 2; 4th group, cells incubated with only medium as control of group 1. Data are presented as mean ± SD. Statistical significance: **** P < 0.0001. b) MTT assay results: 1st group, cells incubated with 24 h of antipollution blend only; 2nd group, 1 h of UV exposure to cells prior to MTT assay, which were incubated with antipollution blend for 24 h; 3rd group, 1 h of UV exposure to cells prior to MTT assay, which were incubated with grape seeds for 24 h; 4th group, 1 h of UV exposure to cells prior to MTT assay, which were incubated with medium for 24 h; 5th group, cells incubated with 0.1% DMSO control for 24 h as control of group 1, 6th group, cells incubated with medium only for 24 h as control. Data are presented as mean ± SD. Statistical significance: nonsignificant (NS), P > 0.05; * P < 0.05; ** P < 0.01; *** P < 0.001; **** P < 0.0001.

