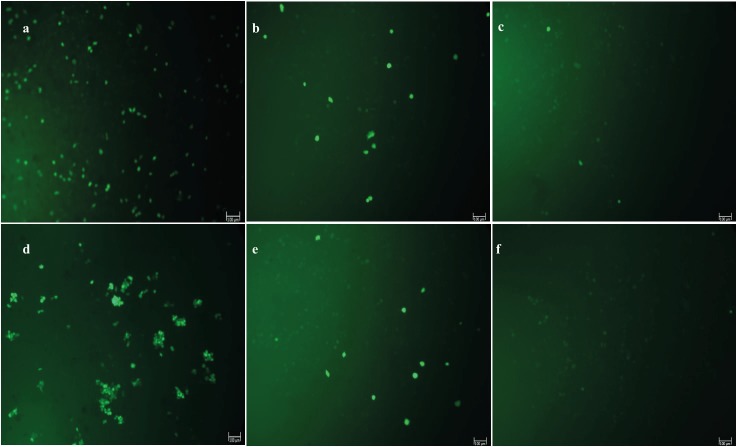
Figure 3.
Microscopic images for DCF fluorescent staining proportional to ROS accumulation. a) HS2 cells treated with B[a]P for 24 h, b) HS2 cells incubated with antipollutant blend for 24 h prior to 24 h of B[a]P exposure, c) untreated HS2 cells, d) L929 cells treated with B[a]P for 24 h, e) L929 cells incubated with antipollutant blend for 24 h prior to 24 h of B[a]P exposure, f: untreated L929 cells.

