Figure 6.
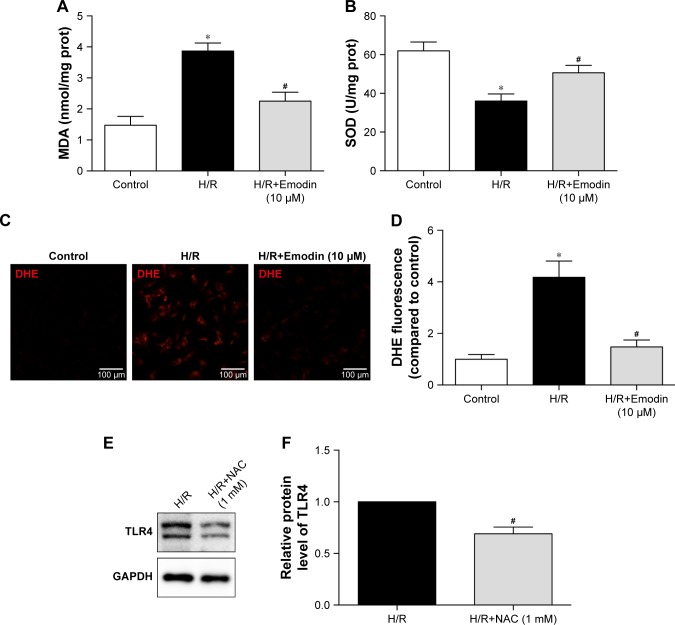
Emodin inhibited the expression of TLR4 by decreasing ROS production.
Notes: (A) MDA levels among the control, H/R, and H/R+Emodin (10 µM) groups. (B) SOD activities among the control, H/R, and H/R+Emodin (10 µM) groups. (C) DHE fluorescence imaging of ROS in primary cardiomyocytes. (D) Histograms of DHE fluorescence based on the results of 6C. (E) Representative Western blot luminogram of TLR4. (F) Protein semiquantification is shown for TLR4 based on the results of 6E. The protein level was standardized by GAPDH. Data are expressed as the mean ± SD. *P<0.05 vs the control group, #P<0.05 vs the H/R group.
Abbreviations: ROS, reactive oxygen species; MDA, malondialdehyde; H/R, hypoxia/reoxygenation; SOD, superoxide dismutase; DHE, dihydroethidium; NAC, N-acetylcysteine.

