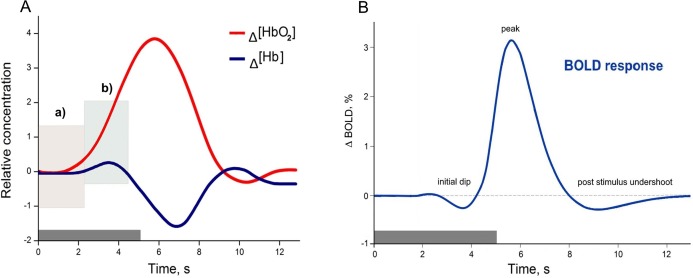
Figure 1. Examples of canonical hemodynamic response (A), and hemodynamic response function (B).
A neural activity from 0 to 5 s (grey bar) causes neurometabolic and later neurovascular coupling, which can be seen as a delay of response (around 2 s). Box in hemodynamic response (A) indicates (a) small inflow of Δ(HbO2), when the total blood volume is still relatively unchanged (due to increased cerebral blood flow), and later (b) Δ(HbO2) increases rapidly due to functional hyperemia caused by vasodilatation. The small increase of Δ(Hb) occurs due to insufficient washout when the cellular oxygen demand exceeds current supply in a tissue. The canonical example of a hemodynamic response is based on measuring the composition of cerebral blood volume via chromophore concentration changes (oxy-Hb and deoxy-Hb). fNIRS studies can directly measure both oxy-Hb and deoxy-Hb), (Venclove, Daktariunas & Ruksenas, 2015). In contrast, the canonical hemodynamic response function (HRF) from the Blood Oxygenation Level Dependent (BOLD) method represents the magnetic field change in response to the Δ(Hb) curve (B) and is relative to the baseline.

