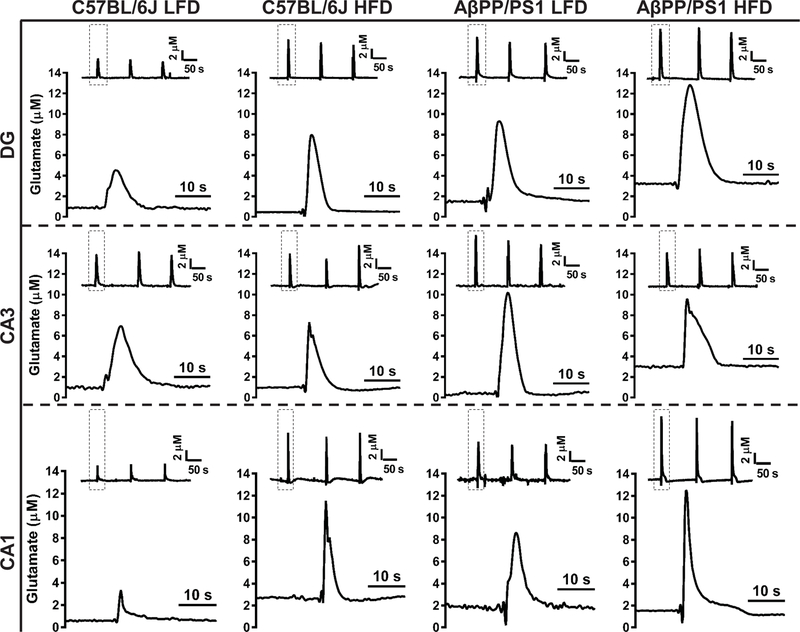
Figure 3: Stimulus-Evoked Glutamate Release Traces.

Representative traces of glutamate release from 70 mM KCl stimulation. Columns indicate genotype and diet while rows indicate hippocampal subfield. Within each panel, the inset trace depicts the reproducibility of the glutamate signals with the dashed box indicating a single response magnified beneath for a clearer presentation of glutamate dynamics. Concentration and time axes are consistent in all panels for comparative interpretation.
